Simulation for Designers - Part 6
Centroidal (Nodal) Results
Carrying on from the previous article I will continue discussing about centroidal results within Nastran In-CAD. Below is an example of centroidal results from different elements.
 So, if we look @ Node C we can have any of the following values displayed.
Maximum option 8.112
Minimum option 6.998
Average option (7.647+7.357+8.112+6.998)/4 = 7.529
Again, in an ideal world we should also look for less than 10% difference between corner average and centroidal average results in the area of interest as another sanity check for convergence of results.
In the picture below, we can see the stress results are above 10% due to stress singularities present in the model so do take care interpreting results. In other words, the maximum and minimum values are not in the same location. In these situations, using fringe display and probes can proof to be useful as mentioned in the previous articles.

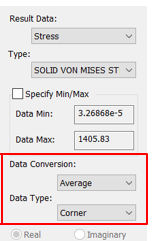
There is also a great article on “Nastran In-CAD: Understanding Data Conversion, Data Type, and Contour Type” by John Holtz from Autodesk which you may find very useful. (https://goo.gl/45uesu).
I hope you found this article useful stay tuned till next week when I will discuss Safety Factor plots within Nastran In-CAD.
NB: If you cannot wait and would like to learn more about Nastran In-CAD now then I would recommend the 'Up and Running with Autodesk Nastran In-CAD 2019' book available from Amazon worldwide.
If you would to watch some of the videos I have created around Autodesk Simulation then please take a look at our Simulation webinar library.


